








SPORTS ANALYTICS · PROJECT 19
Project 20 · Football Analytics
Simulation and Poisson · Nations League 2026/27 Predictions
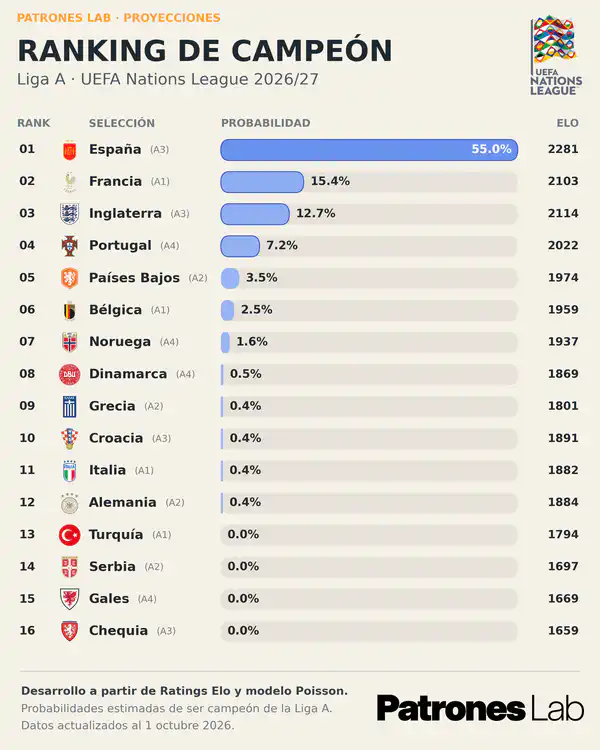
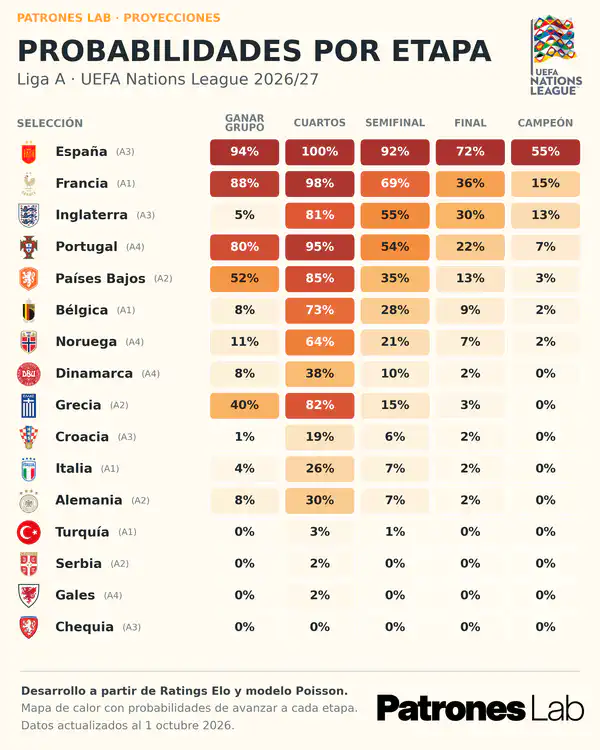
Simulation of one million Nations League 2026/27 scenarios using Elo ratings, win, draw and loss probabilities, and a Poisson distribution to simulate the number of goals in each match. The aim is to estimate the probabilities of winning the group, progressing through the knockout rounds and becoming champion.
CONTEXT AND OBJECTIVE
To build a probabilistic model that estimates how League A of the Nations League 2026/27 may unfold, taking into account the competitive strength of each national team, home advantage and the tournament format.
The analysis combines Elo ratings, match outcome probabilities, goal simulation and Monte Carlo simulation to estimate the probabilities of winning the group, progressing through the knockout rounds and becoming champion.
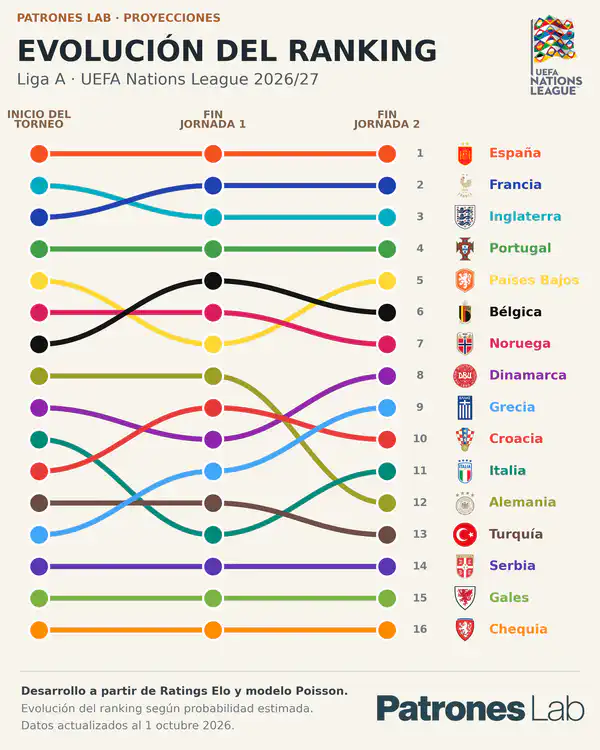
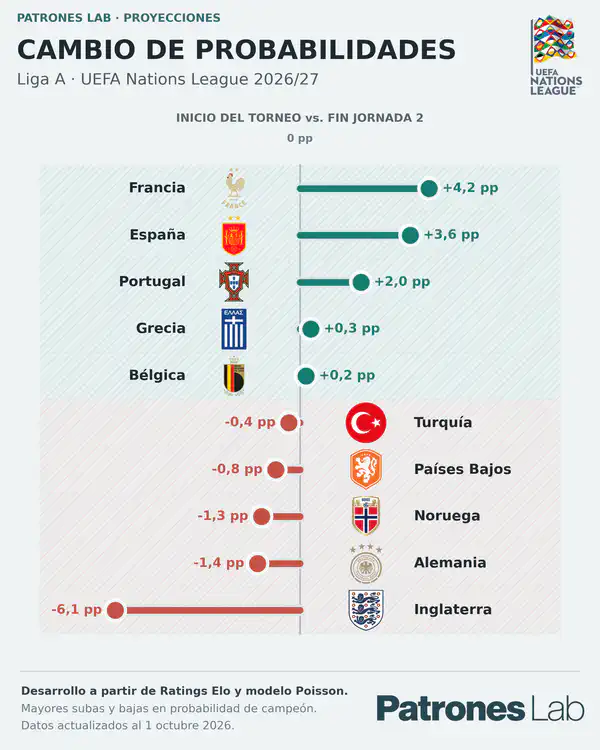
Each update incorporates completed match results and tracks how probabilities change as the competition progresses.
MODEL AND SIMULATION
Relative strength and match probabilities
Elo ratings represent the relative strength of each national team based on its results. For each match, the model uses the difference between the two ratings and incorporates home advantage.
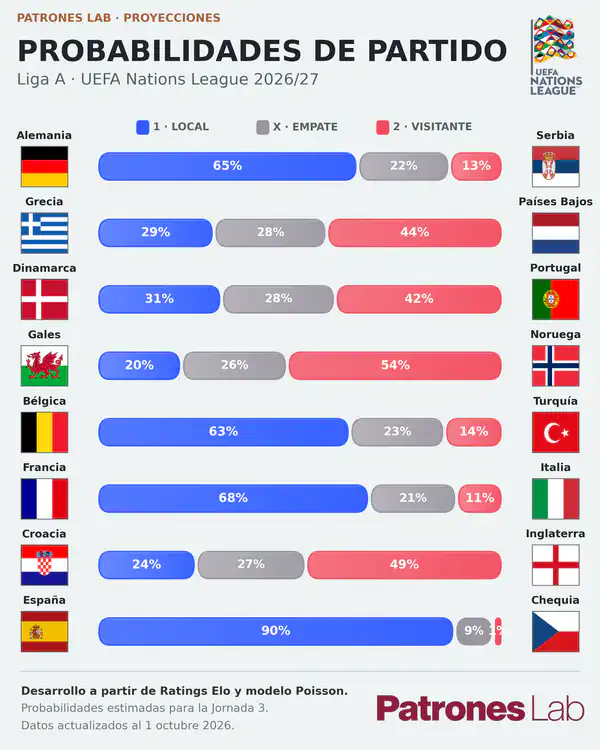
These variables are combined in a Davidson model, which translates the relative strength of the national teams into three probabilities for each match: a home win, a draw and an away win.
Davidson model
d = EloL + h − EloV
r = 10^(d/400)
P(L), P(E) and P(V) under Davidson
h represents home advantage: 100 Elo points for non-neutral matches and 0 at neutral venues. ν is the draw parameter fitted by maximum likelihood.
The model is fitted using historical League A matches, so the probabilities reflect the patterns observed within the competition itself.
Goal simulation with Poisson
An expected number of goals is estimated for both national teams in each match. A Poisson distribution then assigns probabilities to the different possible goal counts.
Poisson distribution
P(X = k) = e⁻λ · λᵏ / k!
X represents the number of goals, k each possible count and λ the expected number of goals for that team in the match.
The simulated goals produce a score for each match and allow points, goal difference and group positions to be calculated.
Monte Carlo simulation
The full process runs 1,000,000 simulations of the competition. Completed match results remain fixed, while pending matches are simulated from the group stage through to the title decider.
Each scenario calculates group points, positions and tie-breaking criteria. Qualifying teams progress through the quarter-finals, semi-finals and final, including extra time and penalties when required.
The probability of each event is obtained from how often it occurs across all simulations.
Probability estimated by simulation
P(A) ≈ Nₐ / N
N = 1,000,000
NA represents the number of simulations in which the event being analysed occurs.
This procedure estimates the probabilities of winning the group, reaching the quarter-finals, semi-finals and final, and becoming champion.
DELIVERY AND LEARNING
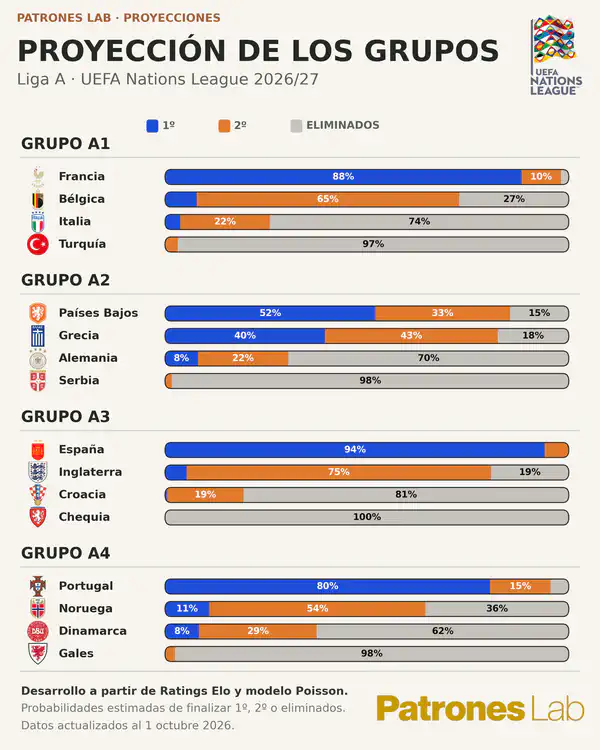
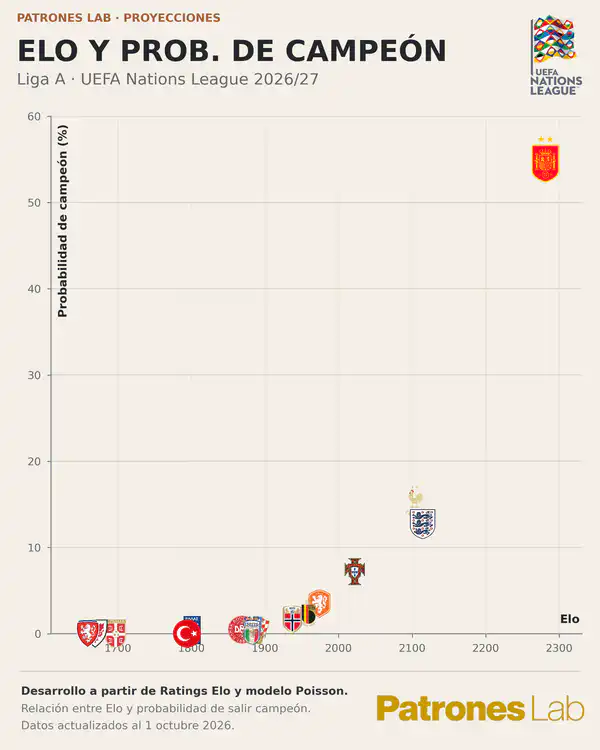
The outputs summarise each national team’s probabilities of winning its group, reaching the quarter-finals, semi-finals and final, and becoming champion.
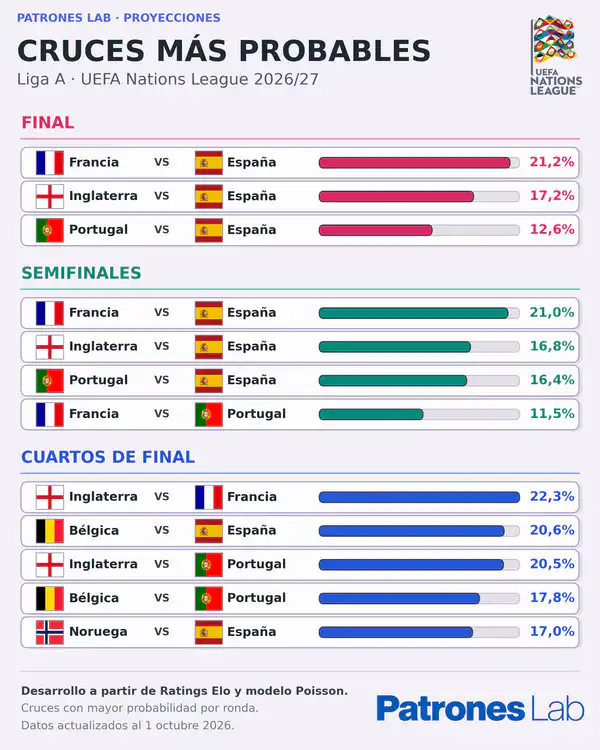
The analysis includes distributions of points, positions and possible match-ups, enabling comparison of the scenarios generated by the million simulations.
Each update incorporates new results, reruns the simulation and retains the probability history. This tracking shows how each national team’s chances evolve as the Nations League progresses.
The project integrates data preparation, Elo ratings, Davidson probability modelling, Poisson goal simulation and Monte Carlo simulation in a reproducible process that can be updated.
GALLERY